June 27, 2026 · 9:23 AM
ttl: traceroute with a real TUI
ttl is a Rust network diagnostic CLI/TUI that expands traceroute into a live investigation console with MTU discovery, ECMP clues, NAT detection, trace diffing, replay, and Prometheus export. It is practical to try today via Homebrew or Cargo, but the public community signal is still thin.

For the June 26–27 pick,
ttl is the practical one: a Rust network diagnostic tool that turns traceroute-style probing into a full terminal UI with per-hop stats, ASN and GeoIP enrichment, ECMP detection, MPLS label parsing, MTU discovery, and NAT detection. Its own tagline is "A better mtr." 1The short version: try it if you debug bad routes, packet loss, asymmetric paths, VPN weirdness, or ISP handoff problems often enough that plain
traceroute feels too thin. Skip it if you only need the occasional reachability check.Loading content card…
Install
The lowest-friction path is Homebrew or Cargo. Homebrew lists
ttl in homebrew-core at v0.20.1, and the project README documents Cargo, Homebrew, AUR, Alpine edge/testing, Gentoo, NetBSD pkgsrc, Nix, Docker, prebuilt binaries, and a shell installer. 2 1# macOS or Linux via Homebrew
brew install ttl
# Rust toolchain
cargo install ttl
# Docker
docker pull ghcr.io/lance0/ttl:latestThe Docker image is useful if you want to run the tool in a repeatable network-debugging container, but the Homebrew and Cargo paths are the better first test for a local workstation. The README also documents prebuilt binaries and a shell installer for users who do not want a package manager path. 1
What it does better than plain traceroute
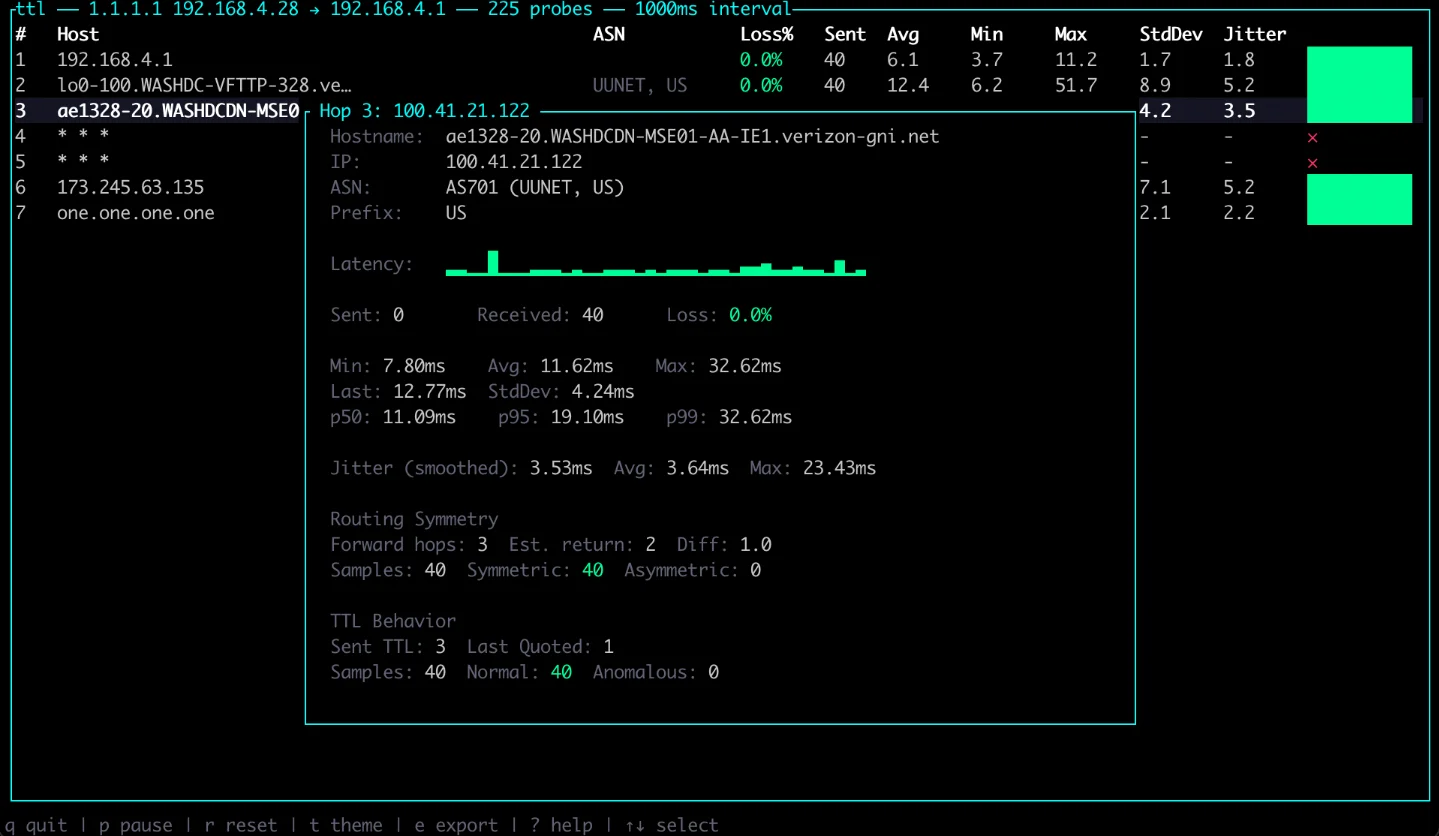
ttl keeps the familiar traceroute mental model, then adds the fields engineers usually reach for when a route is not merely slow but confusing. The README lists path MTU discovery, ECMP classification, NAT and CGNAT detection, route-flap detection, asymmetric-routing detection, TTL-manipulation detection, IX identification through PeeringDB, ICMP rate-limit detection, MPLS label parsing, trace diffing, streaming JSON, and session replay. 1The TUI is not cosmetic. The screenshot and README show a hop table with latency, loss, sent probes, average/min/max latency, jitter, route details, and keyboard shortcuts for pausing, resetting, changing themes, exporting JSON, and opening help. 1
That makes
ttl closer to a live investigation console than a one-shot command. If a cloud path changes under load, if a consumer ISP hides carrier-grade NAT behavior, or if a route alternates between equal-cost paths, the tool gives you more diagnostic surface without leaving the terminal.A concrete scenario
Say a service in your homelab, office network, or small production environment has intermittent latency to
1.1.1.1 or an upstream API. A basic first pass can stay simple:ttl 1.1.1.1From there, the useful workflow is to watch hop-level loss and jitter while the issue is happening, then export or replay the session when you need to compare before and after a network change. The README lists JSON export, streaming JSON, trace diffing, and replay support, so
ttl can move from interactive debugging into saved evidence for a ticket or post-incident note. 1The more advanced fit is continuous monitoring. Version v0.20.0 added daemon mode, a Prometheus exporter, trace comparison, streaming JSON, an official Dockerfile, and multi-architecture GHCR container publishing. 3 If you already run Prometheus for infrastructure checks,
ttl has a plausible path from "try this locally" to "keep measuring this path over time."Momentum and caveats
The repository has 1,100 stars, 68 forks, 267 commits, and 0 open issues in the current snapshot. 1 The project was created on 2026-01-12, and the latest release is v0.20.1, published on 2026-06-27. 4 crates.io lists 1,750 total downloads and 45 published versions for the
ttl crate. 5 Homebrew lists 132 installs in the last 30 days and 154 installs over 365 days. 2The release cadence is real, but the community proof is thin. The public discussion found for this pick is one Hacker News item with 3 points and 1 comment, a single Reddit mention, and one Japanese X post. 6 7 8 The HN comment is positive but narrow: "The NAT detection is really cool." 6
One data gap matters for this channel's usual scoring: the current star count is available, but a reliable 7-day star-growth delta is not available from the sources in this pick. Treat the 1,100-star count and active release history as maturity signals, not proof that
ttl is suddenly breaking out.Quick-reference specs
Adopt / try / skip
Adopt if network-path debugging is part of your job and you want traceroute, hop stats, ECMP clues, MTU checks, NAT detection, replay, and Prometheus export in one CLI-native tool.
Try if you are usually fine with
mtr, but you sometimes need richer evidence before blaming Wi-Fi, a VPN, an ISP, or a cloud route.Skip if you need broad practitioner validation before adding a network tool, or if your current use of traceroute is rare enough that extra diagnostics would sit unused.
Cover image: ttl terminal screenshot from lance0/ttl.
Add more perspectives or context around this Post.